Three points
to note about investment advice that generally floats around:
- Market movements almost never mirror reality/logic, contrary to what theories such as “Efficient Market Hypothesis” will tell you. As Keynes once remarked “Markets can remain irrational far longer than you or I can remain solvent”
- Analysis always tends to be post facto. Therefore, with the wisdom of hindsight, past events may be justified. But there’s no guarantee that future events will play out similarly.
- Most brokers (in the garb of ‘experts’) are paid to peddle stocks on business news channels by certain investors. Use your judgement before committing capital based on hearsay!
We
invest in equities to make superior returns on our capital (vs fixed deposits
and bonds). There’s greater risk obviously, but we hope our insights/information/luck
will help us get to those superior returns. Aim of this post is to analytically
think through what the drivers of those returns are and how the math behind it
works.
Drivers of Returns:
There
are four aspects that primarily move the needle on returns, and all of our
investment diligence should therefore be centered on these issues:
1) Growth: Splits out into market growth
and market share. Say a market is growing with India’s nominal GDP (15%), and
you think the company can gain some share over time (a nuanced sub-segment level understanding of each of the product lines
of the company is necessary to make this claim!) You assume that the share gain
will be rapid and you underwrite that it would outpace the market by say four points.
Implicitly your revenue growth assumption is 20% (16%+4%).
In the
ideal world, you want to find a company that has some of the following
characteristics (obviously non-exhaustive) to give you comfort about growth
& share:
- Strong competitive position in a high-growth industry driven by high barriers to entry (say technology / patents) and brand loyalty (e.g., iPod)
- Scalable business in a concentrated industry that would see a small subset of players capturing an unfair share of the market growth going forward (e.g., 2 wheelers)
- Relatively free from regulatory hurdles and govt/political influence (therefore keep off infrastructure, real-estate etc)
- Low customer churn with long-term sticky contracts (e.g., BPO) or low customer concentration (e.g., retail industry)
2) Margin: You have to take a call on
COGS (Cost of Goods Sold i.e. direct costs attributable to the production of
goods or raw material costs +conversion/direct costs) and SG&A (Selling, General
& Admin expenses). These two are your main cost buckets that flow through to
your EBITDA.
EBITDA
stands for Earnings before Interest, Tax, Depreciation & Amortization. When
people talk about “operating margin”, they refer to EBITDA margin. EBITDA = Revenue
– COGS – SG&A. Other costs below EBITDA are depreciation & amortization
(both are non-cash expenses), interest on your debt (if any) and taxes. EBITDA – Depreciation & Amortization – Interest – Tax = Profit after Tax or PAT.
Now
that we have the definitions out of the way, you should pay close attention to
how you think gross margins (Revenue less COGS) will play out in your
investment period. Say you assume it will improve due to price increase (basic
inflation + price premium for your products due to better perceived quality)
and lower conversion costs. Say you assume you would gain 0.5% of revenue each
year on gross margins on account of these two levers.
You
also have to consider SG&A – you could get some leverage from employee
expenses, better utilization of facilities etc but could consider increasing
spend on sales & marketing. In our case, let us assume all the savings from
the former is invested in the latter (i.e. sales) and your SG&A margin
remains constant every year.
Therefore,
in this case, your EBITDA margin will expand by 0.5% every year (0.5% increase
due to gross margin expansion and no change in SG&A)
3) Multiple: The multiple on EBITDA or PAT is technically meant to be the closest proxy for future cash flows of the company. In reality though, it changes every minute as expectations change depending on macro environment, regulatory changes, liquidity, significant events at other companies etc. To evaluate the “right” multiple to pay, it’s probably wise to compare the current multiple to the five year average to get a sense on how the multiple has moved over time. In the ideal case, you don’t want to be buying off a high. Remember the age-old truism “Buy low, sell high”.
Super-normal
returns can be made if you believe that the market is currently under-valuing
the company and you have sound reason to believe you are seeing something that
the market isn’t and that the market will hopefully come around over time. Many
industries have re-rated upwards (e.g., consumer) and many have re-rated downwards
(e.g., Mid-tier IT) over time, so it is crucial that you see today’s multiple
in perspective and take a call suitably.
In
general, market-leaders trade at a slight premium, so if you believe your
company (say currently at #2) will eventually be #1 due to superior product
innovation, better management etc, you could underwrite a click or two of
multiple expansion. Nonetheless, this is one area where you would rather be
conservative and wait to buy when there’s a steep correction due to an
uncorrelated event.
4) Changes in capital structure: This is a slightly more complex topic and deals with capital structure of a company. It is rarely a driver of returns in India (given high interest costs, regulations etc) so I’m not in favor of a lengthy discussion. But here’s the short of it, for those who are interested:
Say a company
in the US is worth $1B and it’s debt to equity ratio is 4:1 i.e. $800M of debt
and $200M of equity. You use the company’s current cash flows to pay down say
50% of the debt in your investment horizon. Even if the company’s enterprise
value remains constant and nothing else in the business changes materially, you
are now left with $400M of debt => $600M of equity i.e. 3x return on your
equity simply via debt pay down :) This math gave birth to the LBO industry.
Let us
put what we have learned to good use and do some simple math.
Basic math on how returns work:
Say a
company has year-end revenues of Rs. 100, EBITDA % of 20% and PAT % of
10%.
For the
sake of simplicity, let us value the company on LTM (last twelve months) Price
to Earnings (PE) multiple and say the multiple is 15x. Market cap of the
company = 15x PAT = 15 * 10% * 100 = Rs. 150
Now
say there are 15 shares of the company. Therefore, each is valued at Rs. 10.
You buy say 5 shares from an existing shareholder (technically a ‘secondary
purchase’). Now you own 5/15 shares i.e. 33.3% of the company.
Say
five years down the line (typical time-horizon for a long–term investor), the
company has grown its revenues at 20% CAGR and has been able to maintain EBITDA
and PAT margins (over-simplistic, but let us go with this). Assuming the
multiple doesn’t change, you would make 20% returns YoY on your 5 shares. Your
Rs. 50 now is worth 50*(1+20%)^5 = Rs. 124. Therefore, you have a Multiple of
Money (MoM) of 2.5x and an IRR of 20%. Simple?
Let us flex
the other variables as well, so everyone has the math clear in their heads:
Say the
company’s revenues grew at 20% YoY. Let us now say that the company did a bunch
of operational improvements thereby enhancing its margins and say its PAT grew by
25% YoY. Also assume that the market starts loving the company and starts
paying a premium on its shares, now the multiple expanded from 15x to 18x. What
returns will you make on your 5 shares purchased @ Rs. 10 each?
The
simple P&L will look something like this:
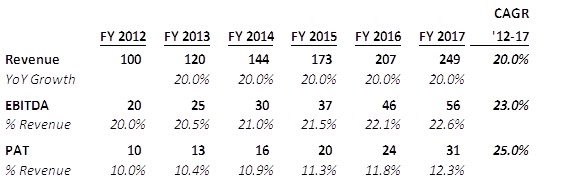
Therefore
the company’s PAT at exit is Rs. 31, the multiple at exit is 18x, therefore market
cap at exit = Rs. 31 * 18 = Rs. 558, up from Rs. 150 at entry.
Share price is now Rs. 558/15 = Rs. 37.2. You own 5 shares, hence your
shares are now worth Rs. 37.2*5 = Rs. 186
Therefore,
your simple returns are:
MoM =
186/50 = 3.7x
IRR =
3.7^(1/5)-1 = 30%. Neat! :)
Note: This return math
assumes none of the following have happened in the investment horizon - dividends/re-caps from excess cash accrued, management options,
interim primary infusion, back-leverage and all other second order issues
I will
(hopefully soon) come up with a separate post on “Nuances to investing in India”
where I will talk about promoter/governance issues, issues with ‘control
transactions’ in India, how bankers try and raise expectations etc.
If you’ve
reached this part, I am assuming you read the post and I hope this was helpful.
I have tried to keep it simple, but if you have any questions, I’m happy to
answer them. You can reach me at utsavmitra@hotmail.com